Updates on WP2 work progress
30/06/2020
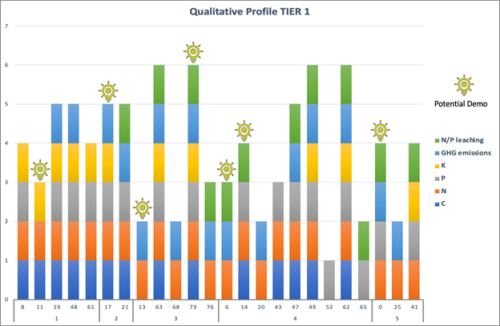
WP2 as a key stage in the innovation funnel, where many of the innovations have started to generate agro-technical research information, and new insights, it is currently collecting data. For the first Tier, that contains 24 single solutions with TRL < 6, long information was collected, thanks to the endeavour from partners in all the consortium. Even so, most of the data is still raw; state-of-the-art, setup of the experiments, and partial or no results yet. In this order, for gaining a first screen overview of the profile of the solution on what they are focusing on, a qualitative portray was generated (Figure below).
As seen in the figure below, it is possible to catch sight on the single solutions, numbered by the long-list number provided on D.2.1, and divided into the 5 research groups (RL). Here, solutions from RL1 and RL2 show up a more complete profile towards N2C goals (supporting C, N, P closing loops and reduce GHG emission). Complementary, the potential demonstration cases selected present a diverse profile, well-distributed along with the 5 RLs. This is advantageous, from the side of getting specialized solutions that could complement others, for building up an integrated solution. The idea is later on, and mostly for the last report on the project, to fill up this target indicators with numbers such as percentages and may see the likelihood to linked with other valuable data.
Within all the expecting results, in all the bunch of study data that will come up in the following months from each researcher behind over 45 solutions. We expect many challenges in the way of synthesizing information and emerge with the most important outcomes. Particularly, for bringing it to a wide–public under a quantitative approach understandable, without losing sight of the N2C’ primary aims, but still keeping detail and credit to all the hard work that is carrying on from each academic on the other side.


 This project has received funding from the European Union’s Horizon 2020